CI Tests to TestRail, Automatically
Automatically export CI test results to TestRail, ALM, Xray, and Zephyr Scale. Pattern-match jobs, map to projects, and sync results without manual effort. Plus CI analytics, flaky test detection, and AI-powered insights.
CI test results where they belong
Sync test results to your TCM tools automatically. Monitor builds, detect flaky tests, and query your CI data with AI.
TCM Integration
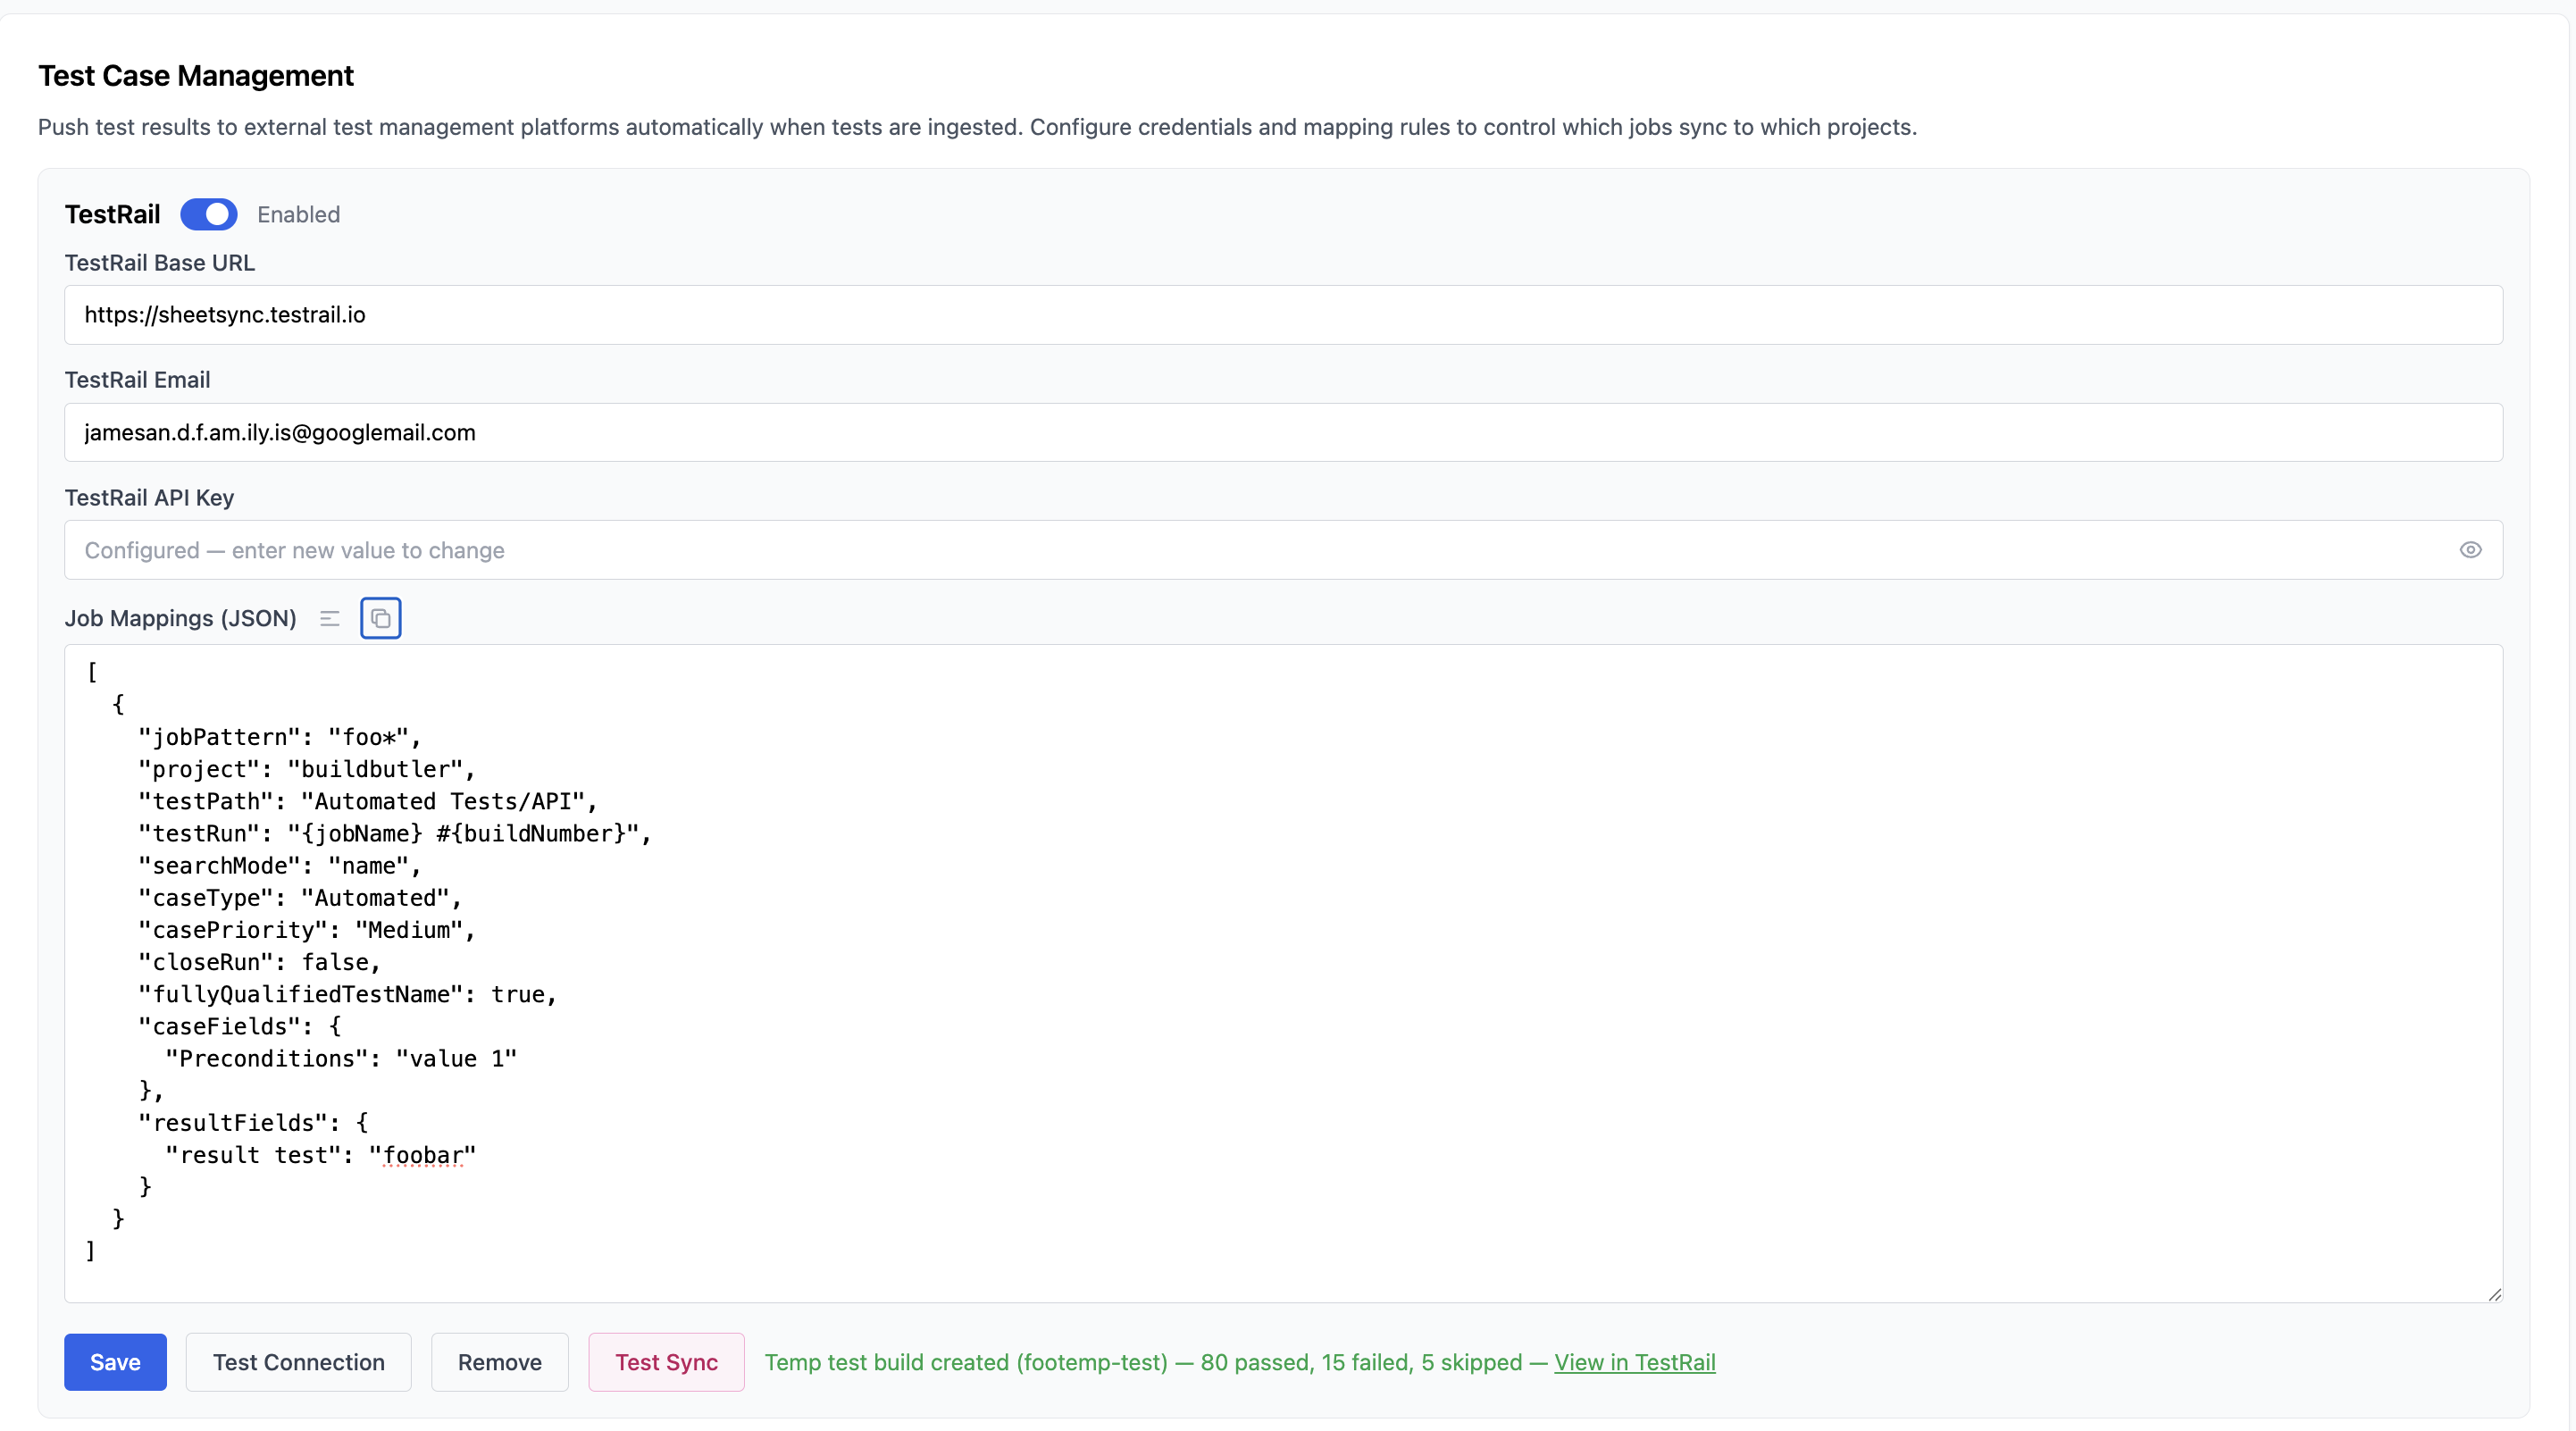
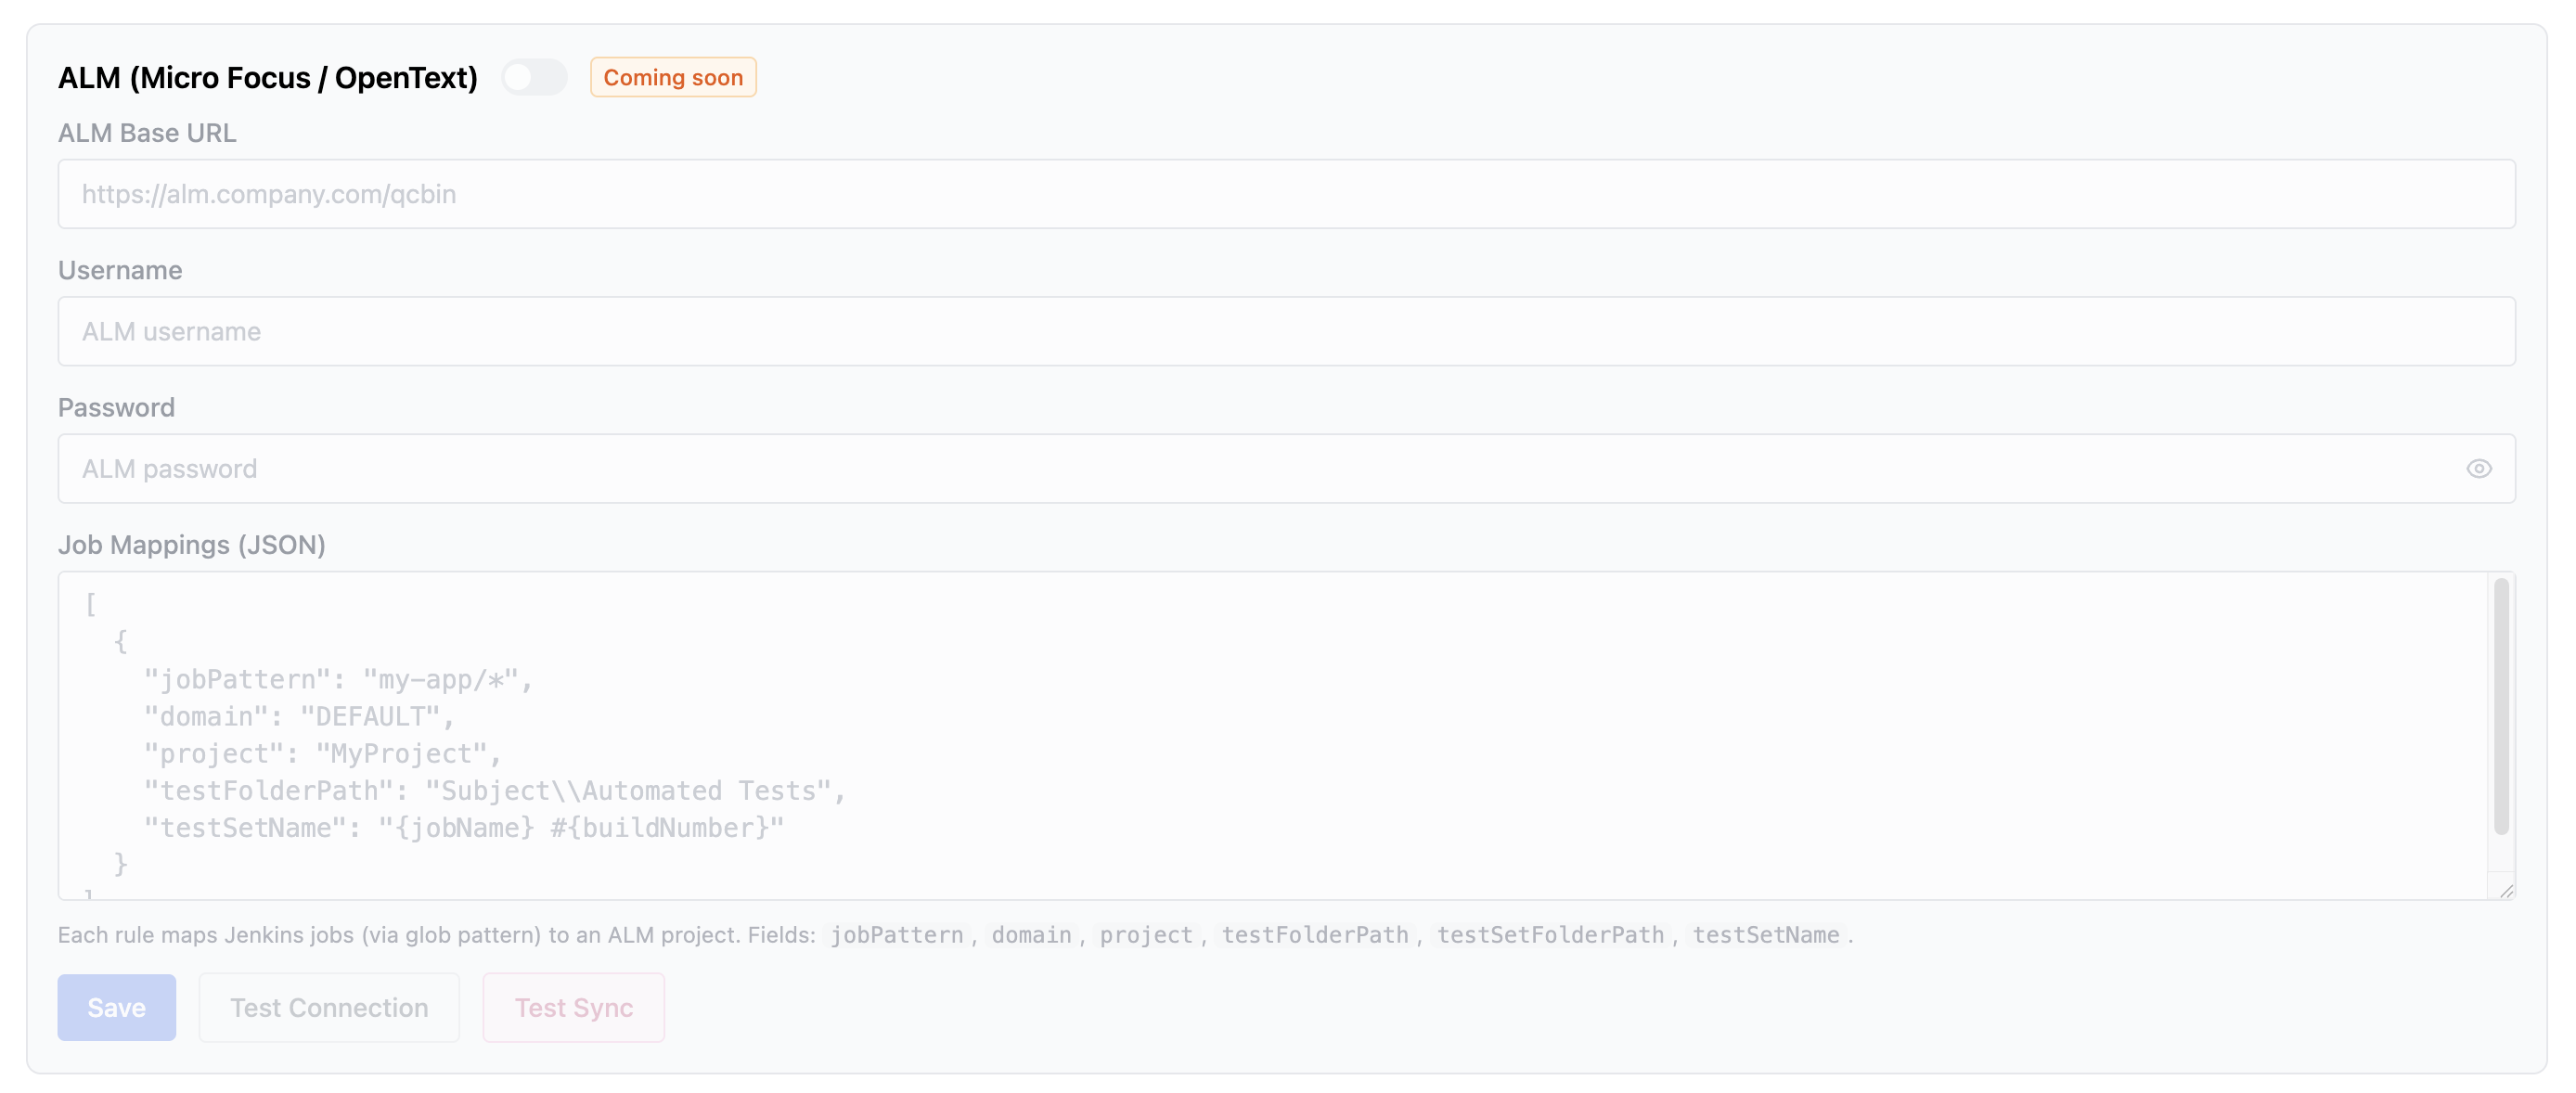
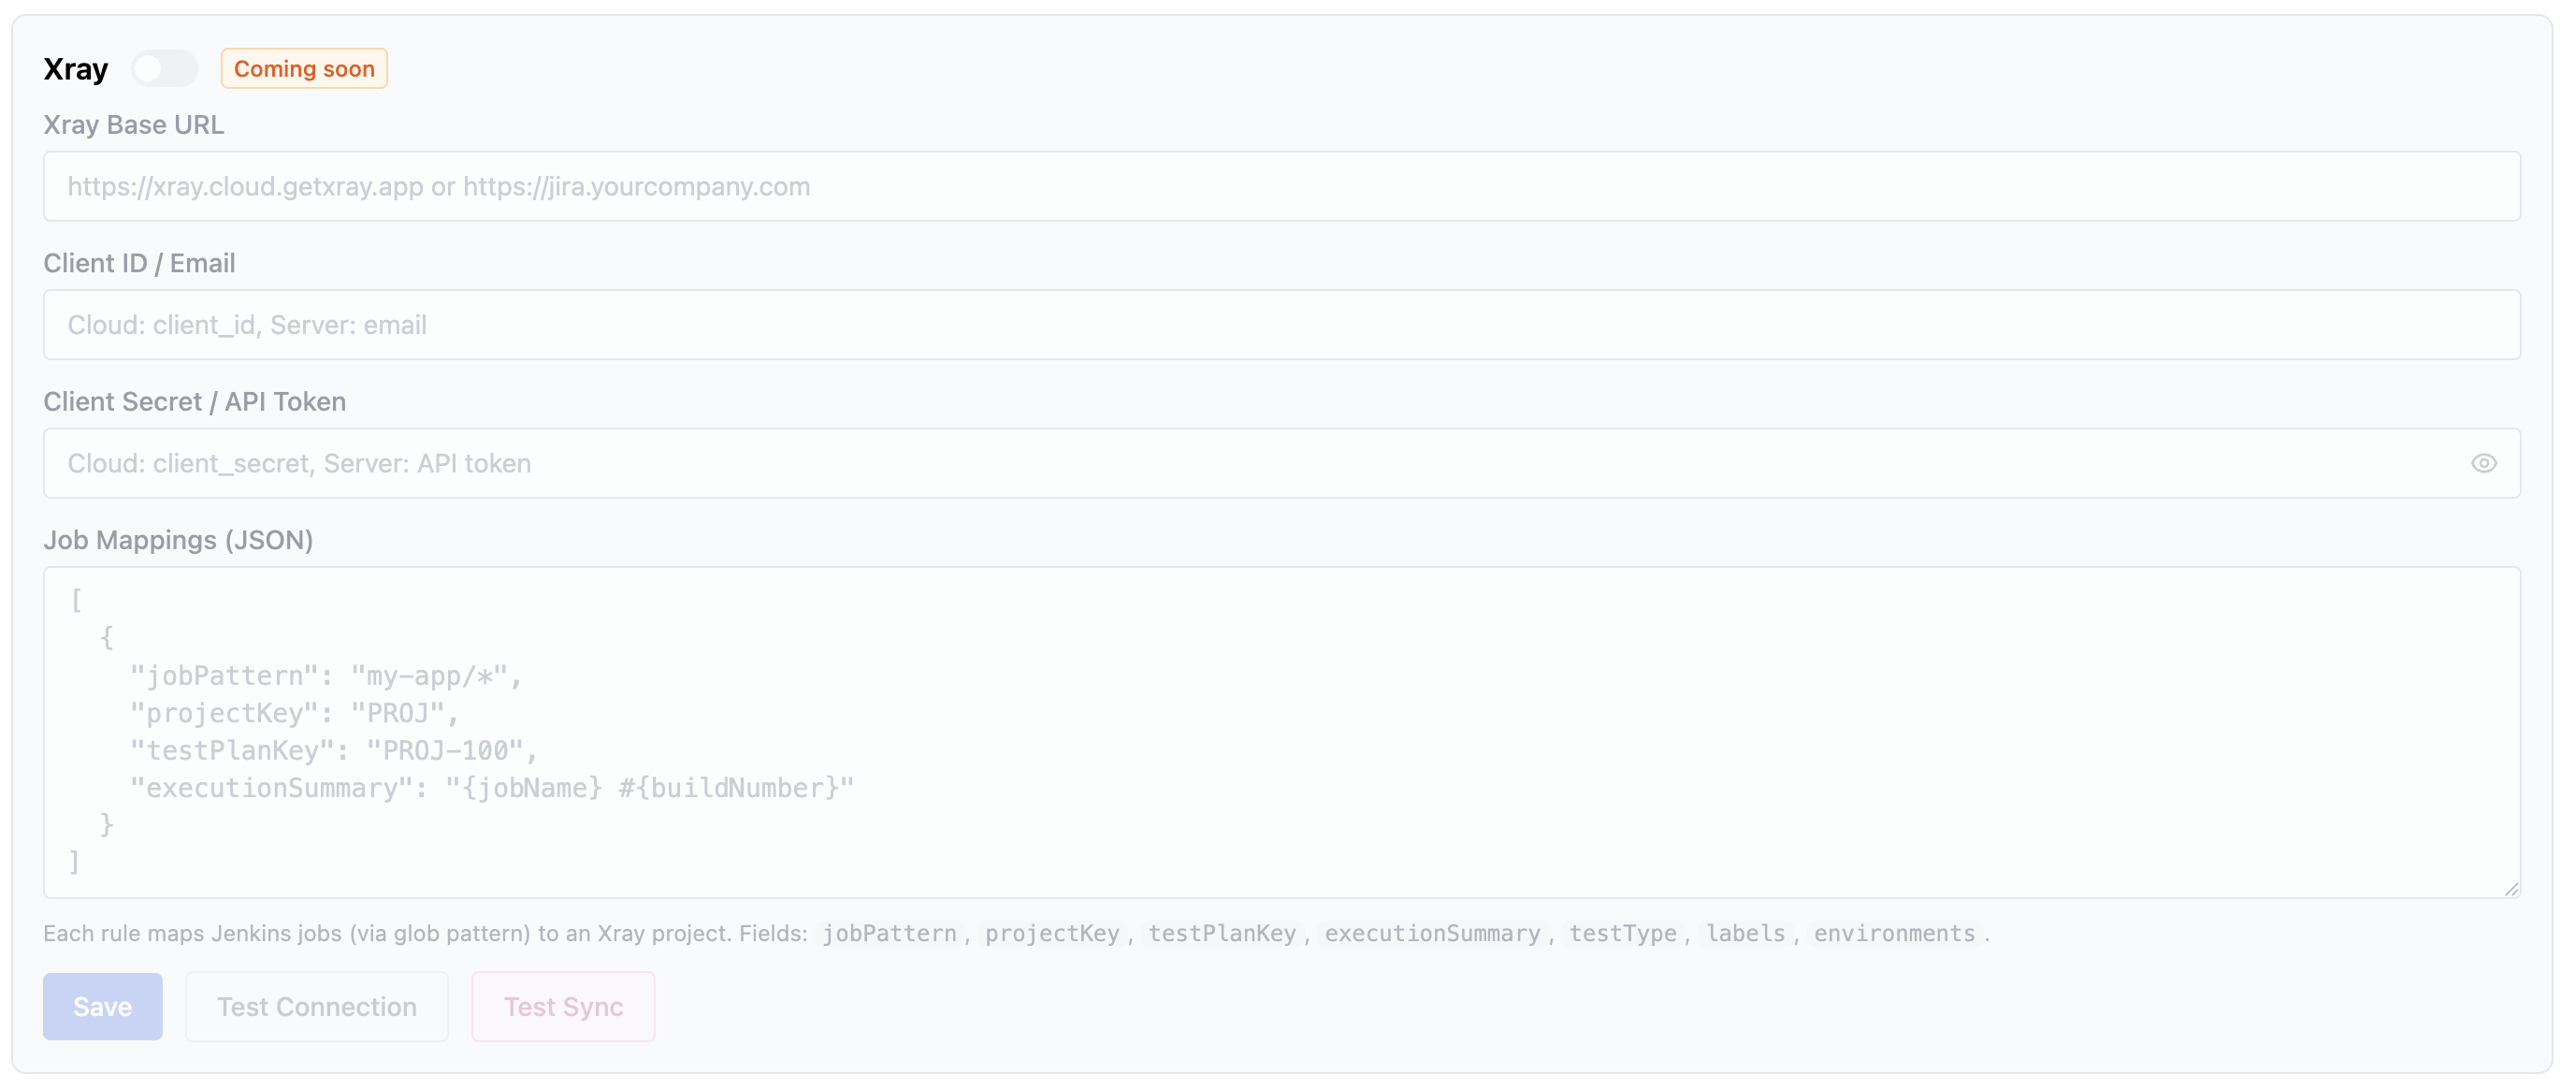
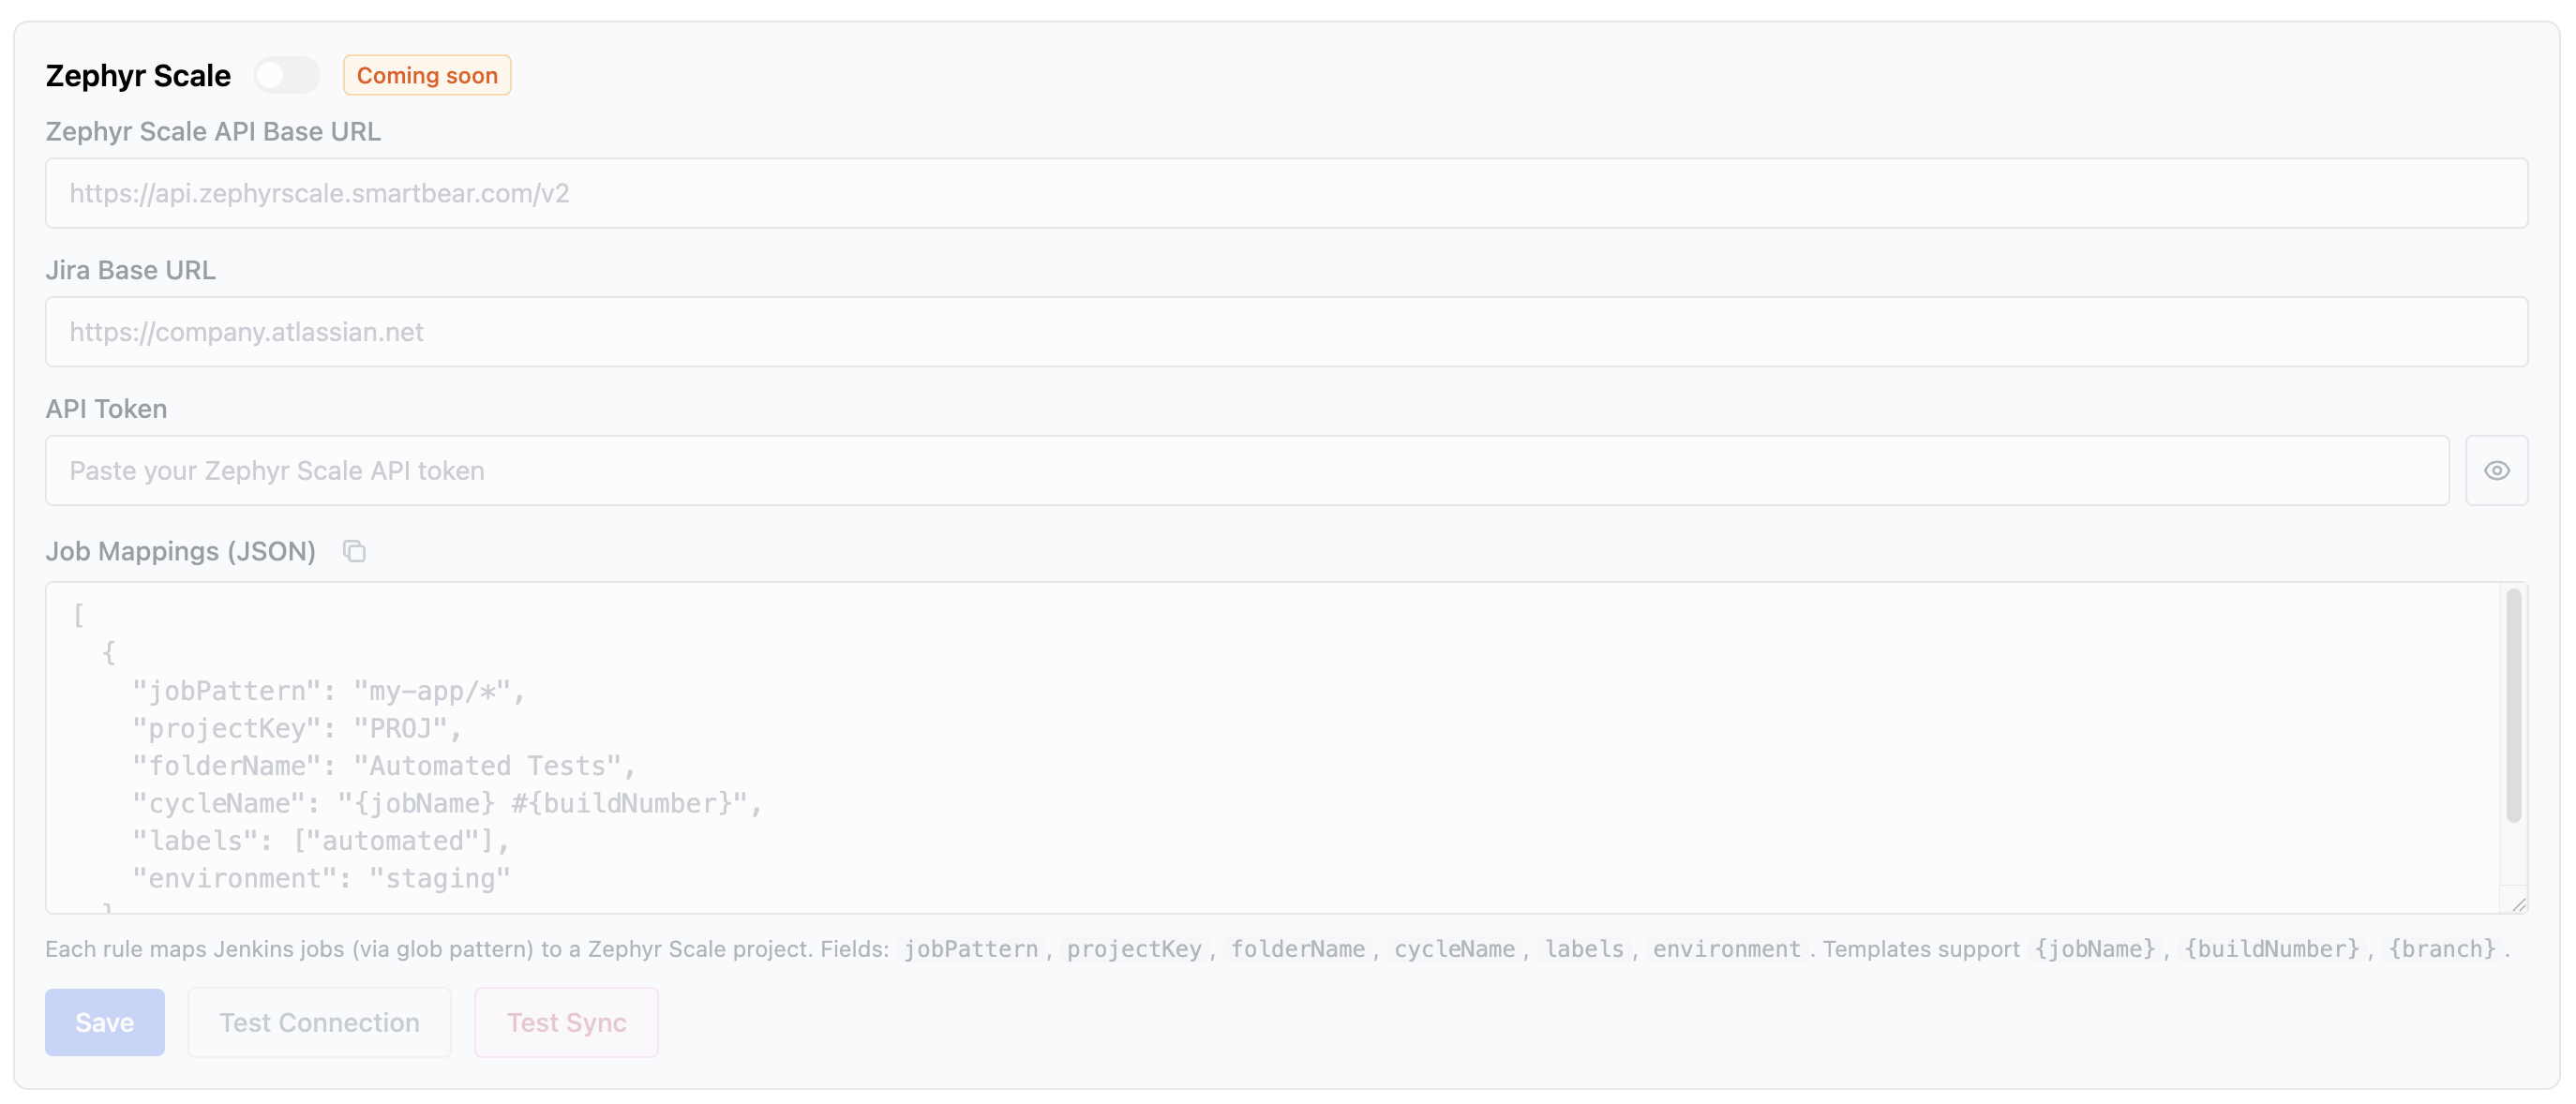
Automatically export CI test results to TestRail, ALM, Xray, and Zephyr Scale. Pattern-match jobs to projects using JSON rules with template variables.
ALM Defect Management
Auto-create, reopen, and close defects in HP ALM based on test results. Configurable severity, status mappings, and custom field values.
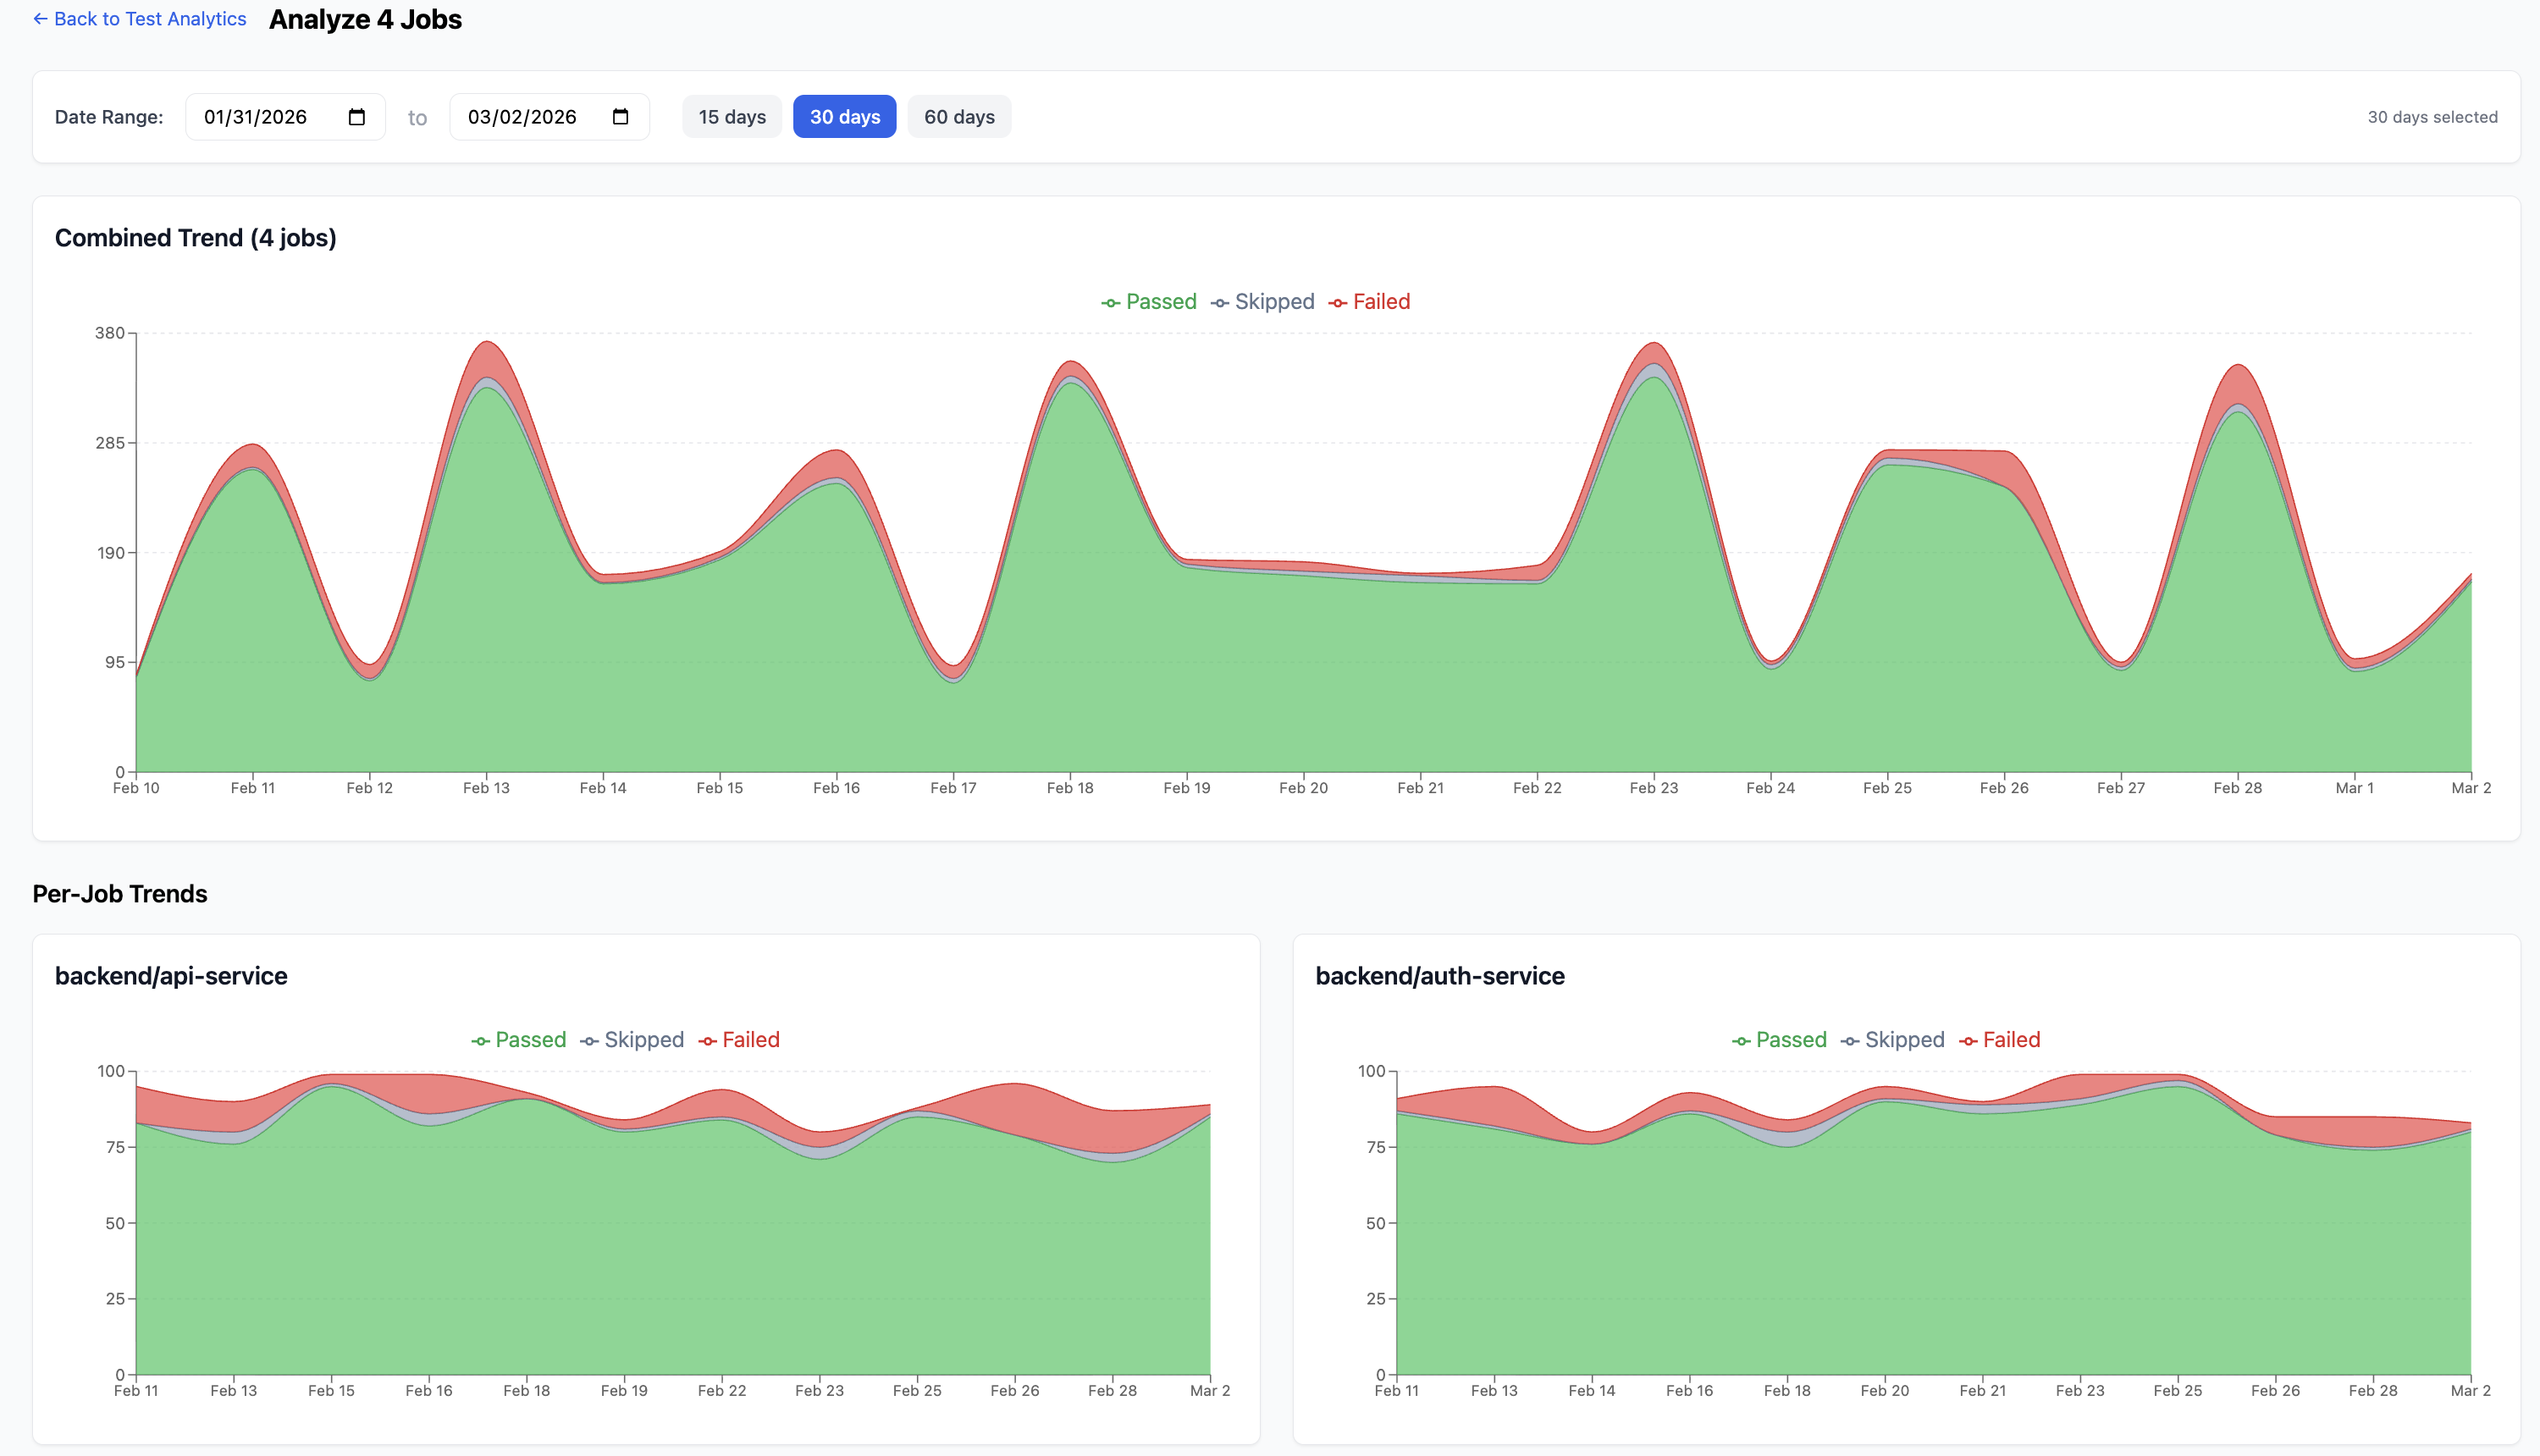
Test Intelligence
Deep test result analysis with flaky test detection, test history tracking, and failure pattern recognition.
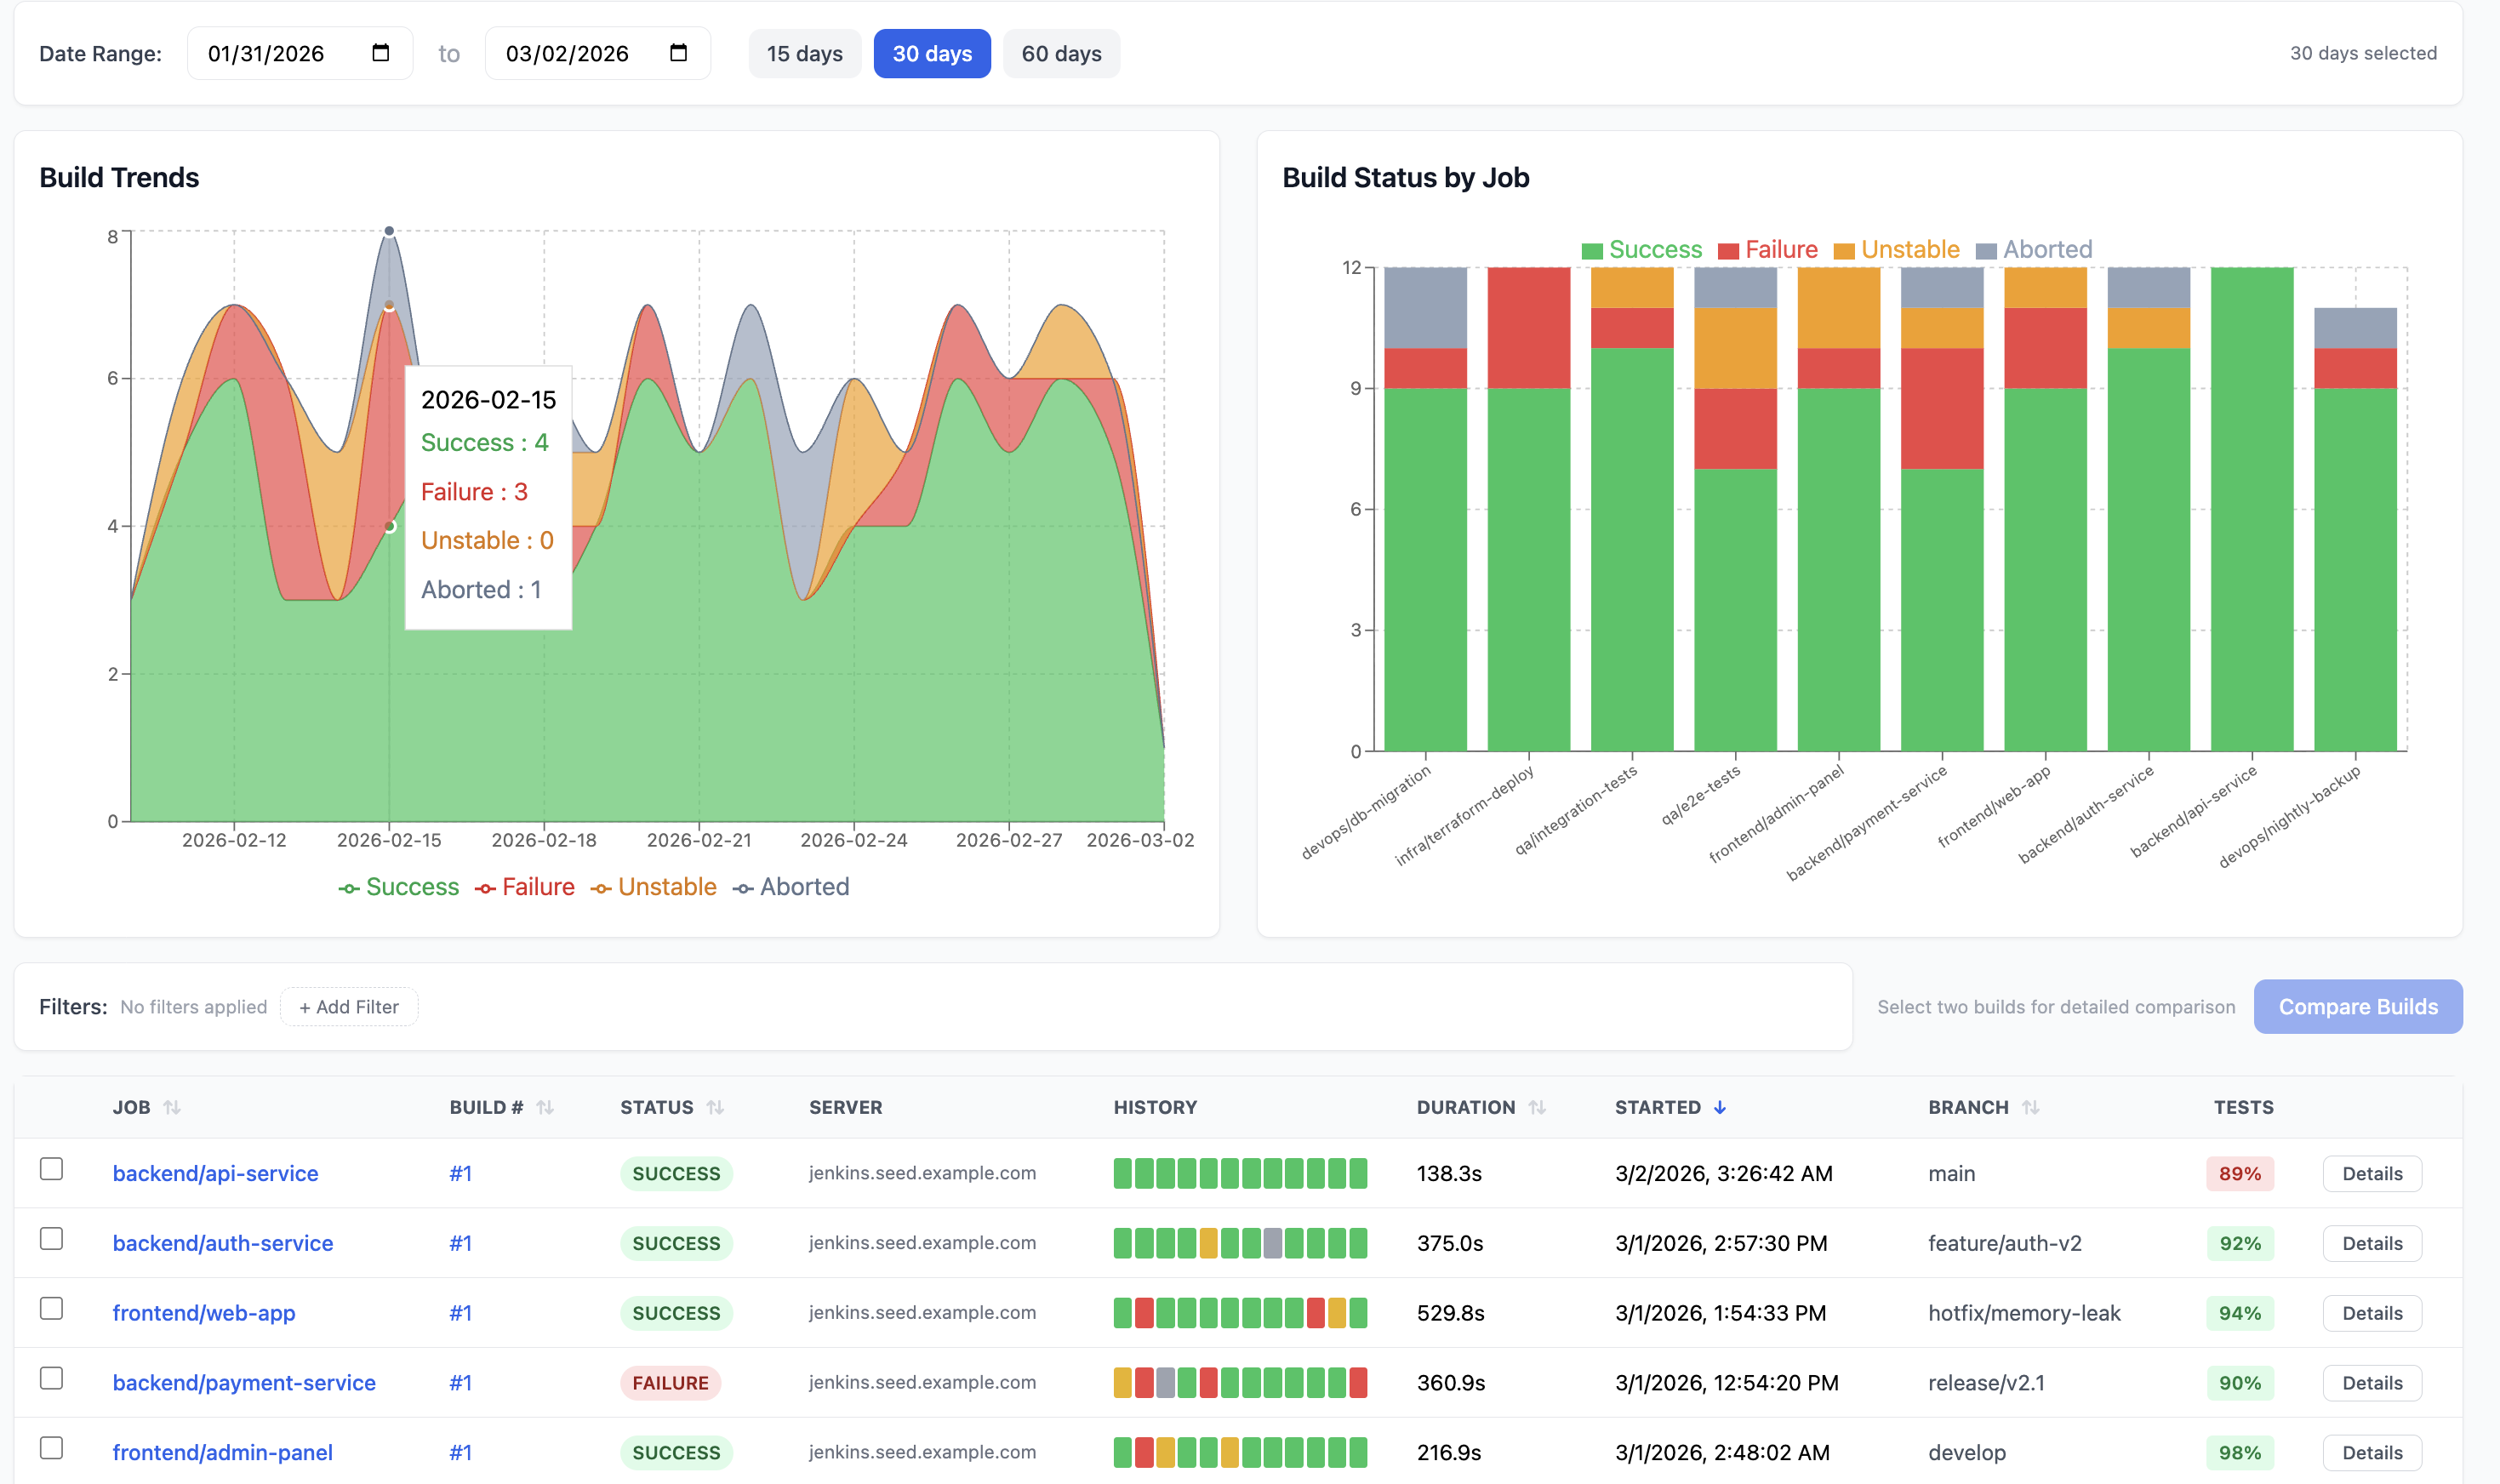
Build Analytics
Real-time build trends, success rates, and duration metrics across all your Jenkins jobs and pipelines.
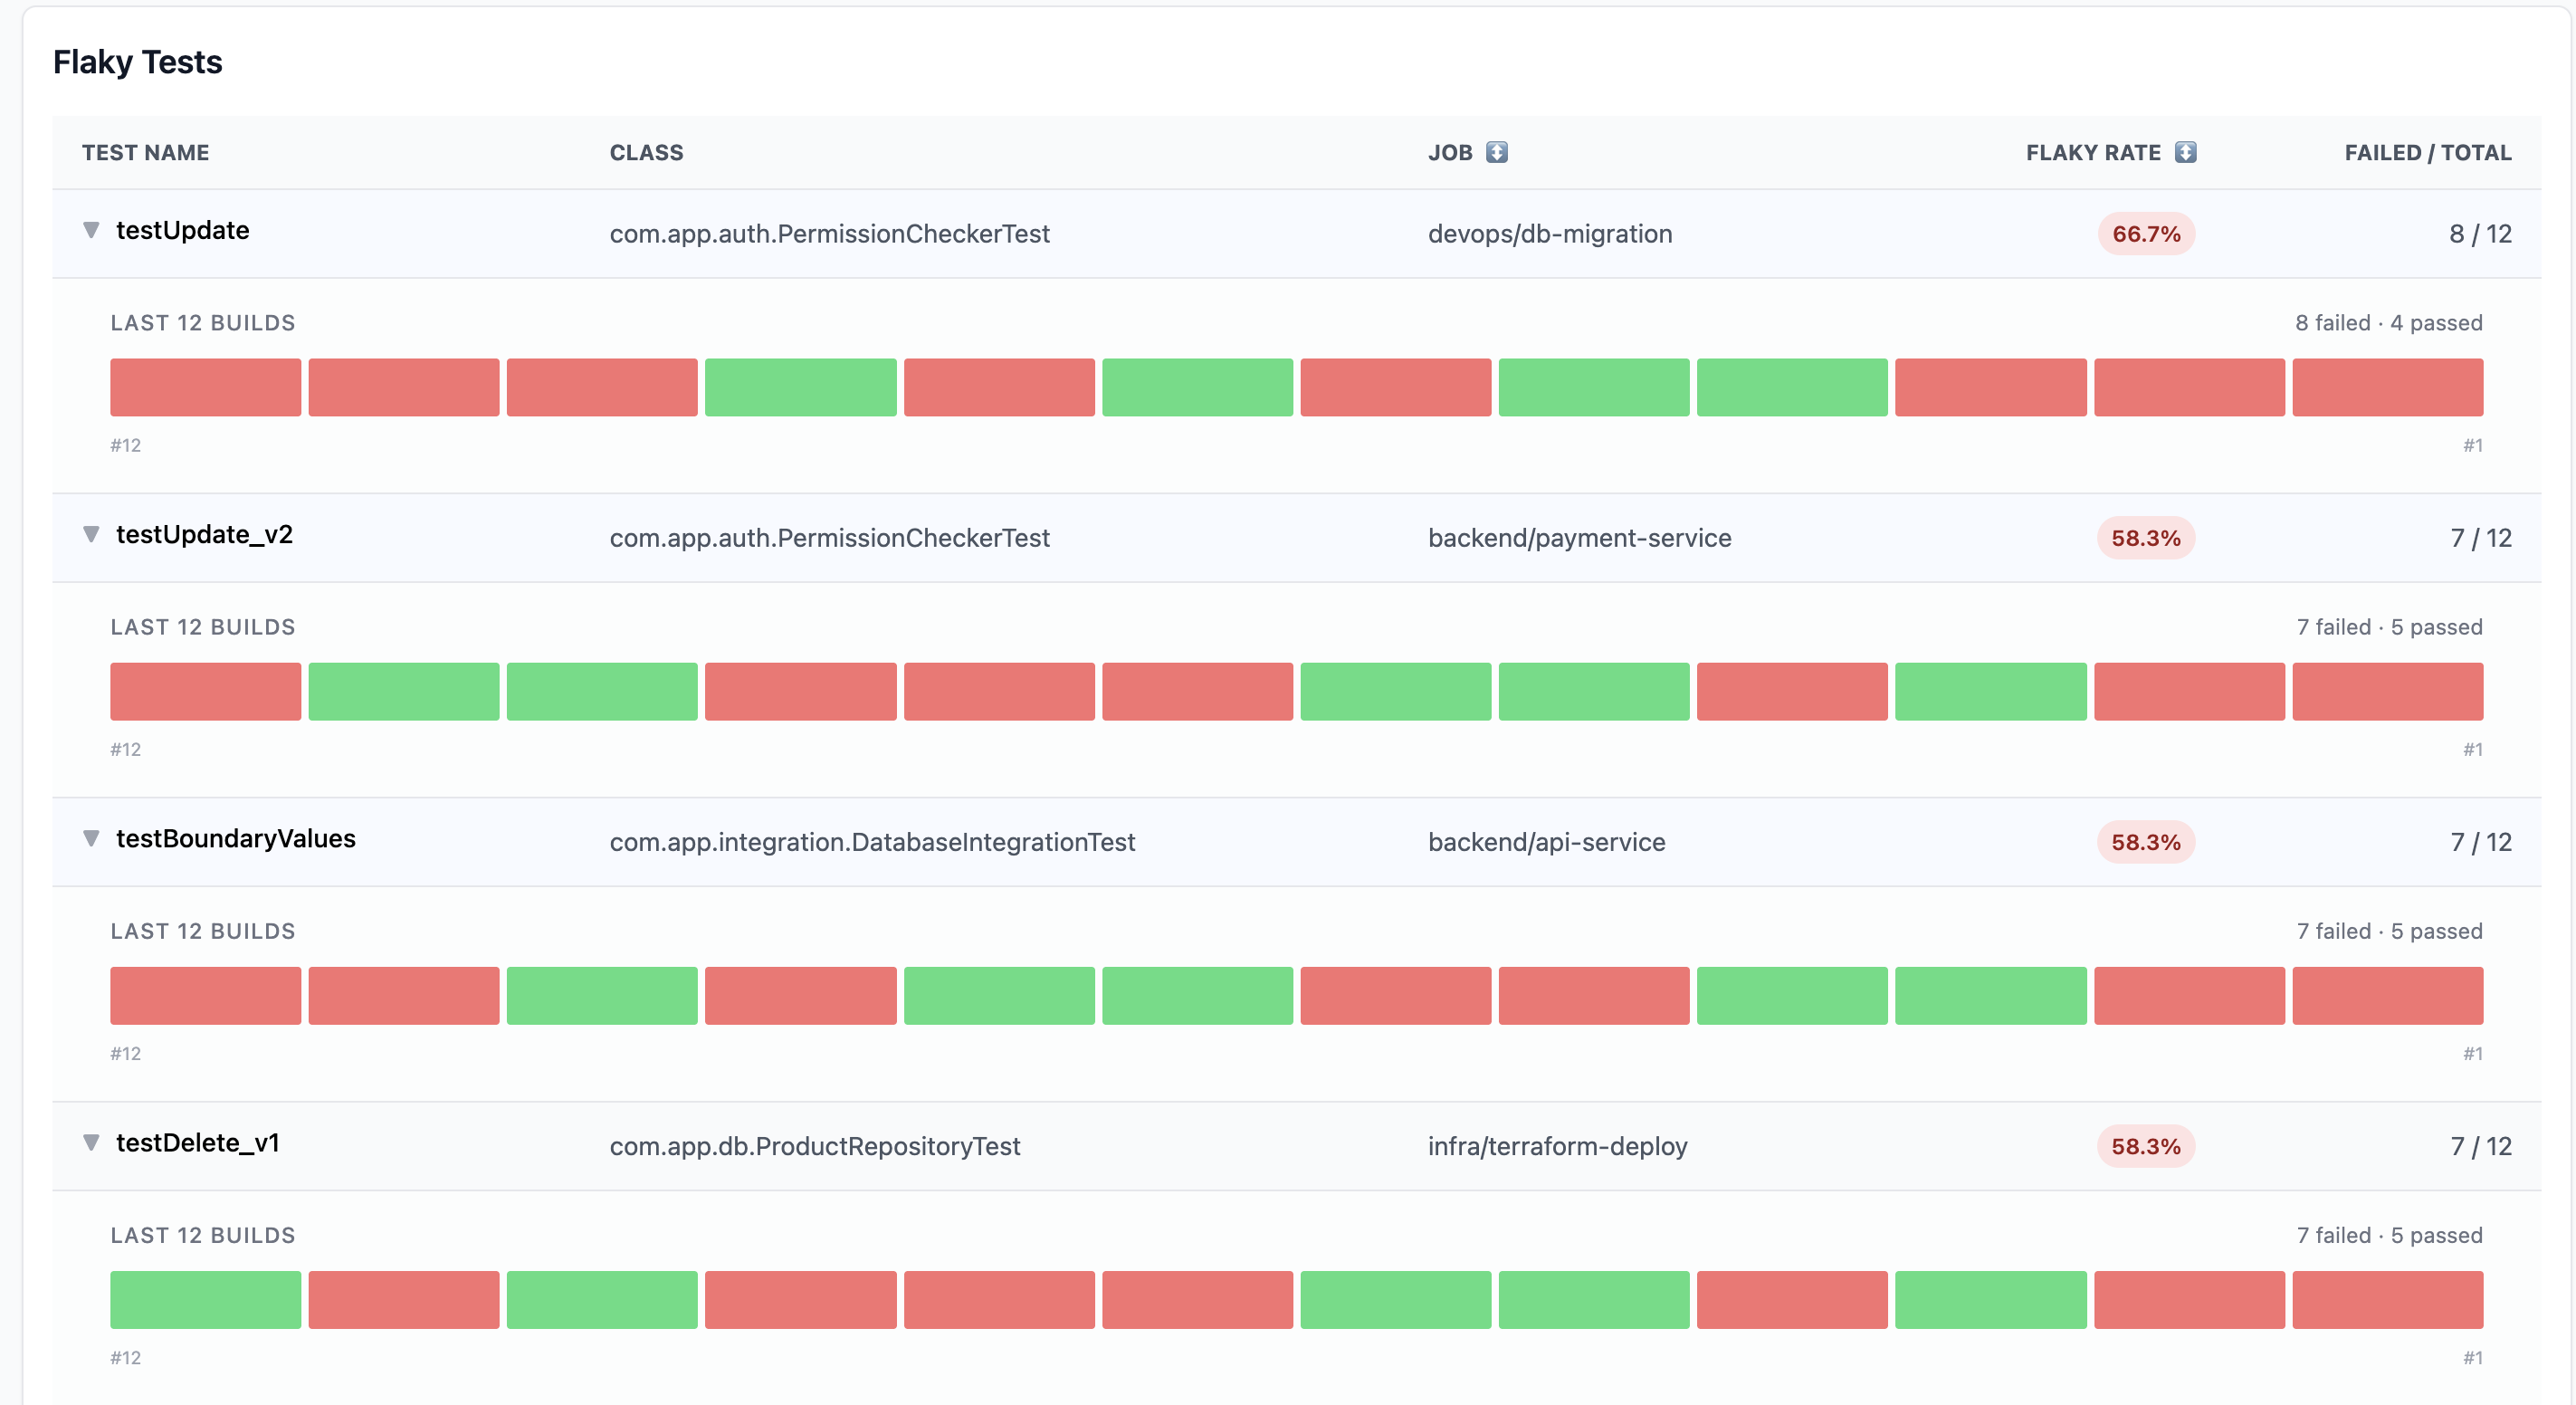
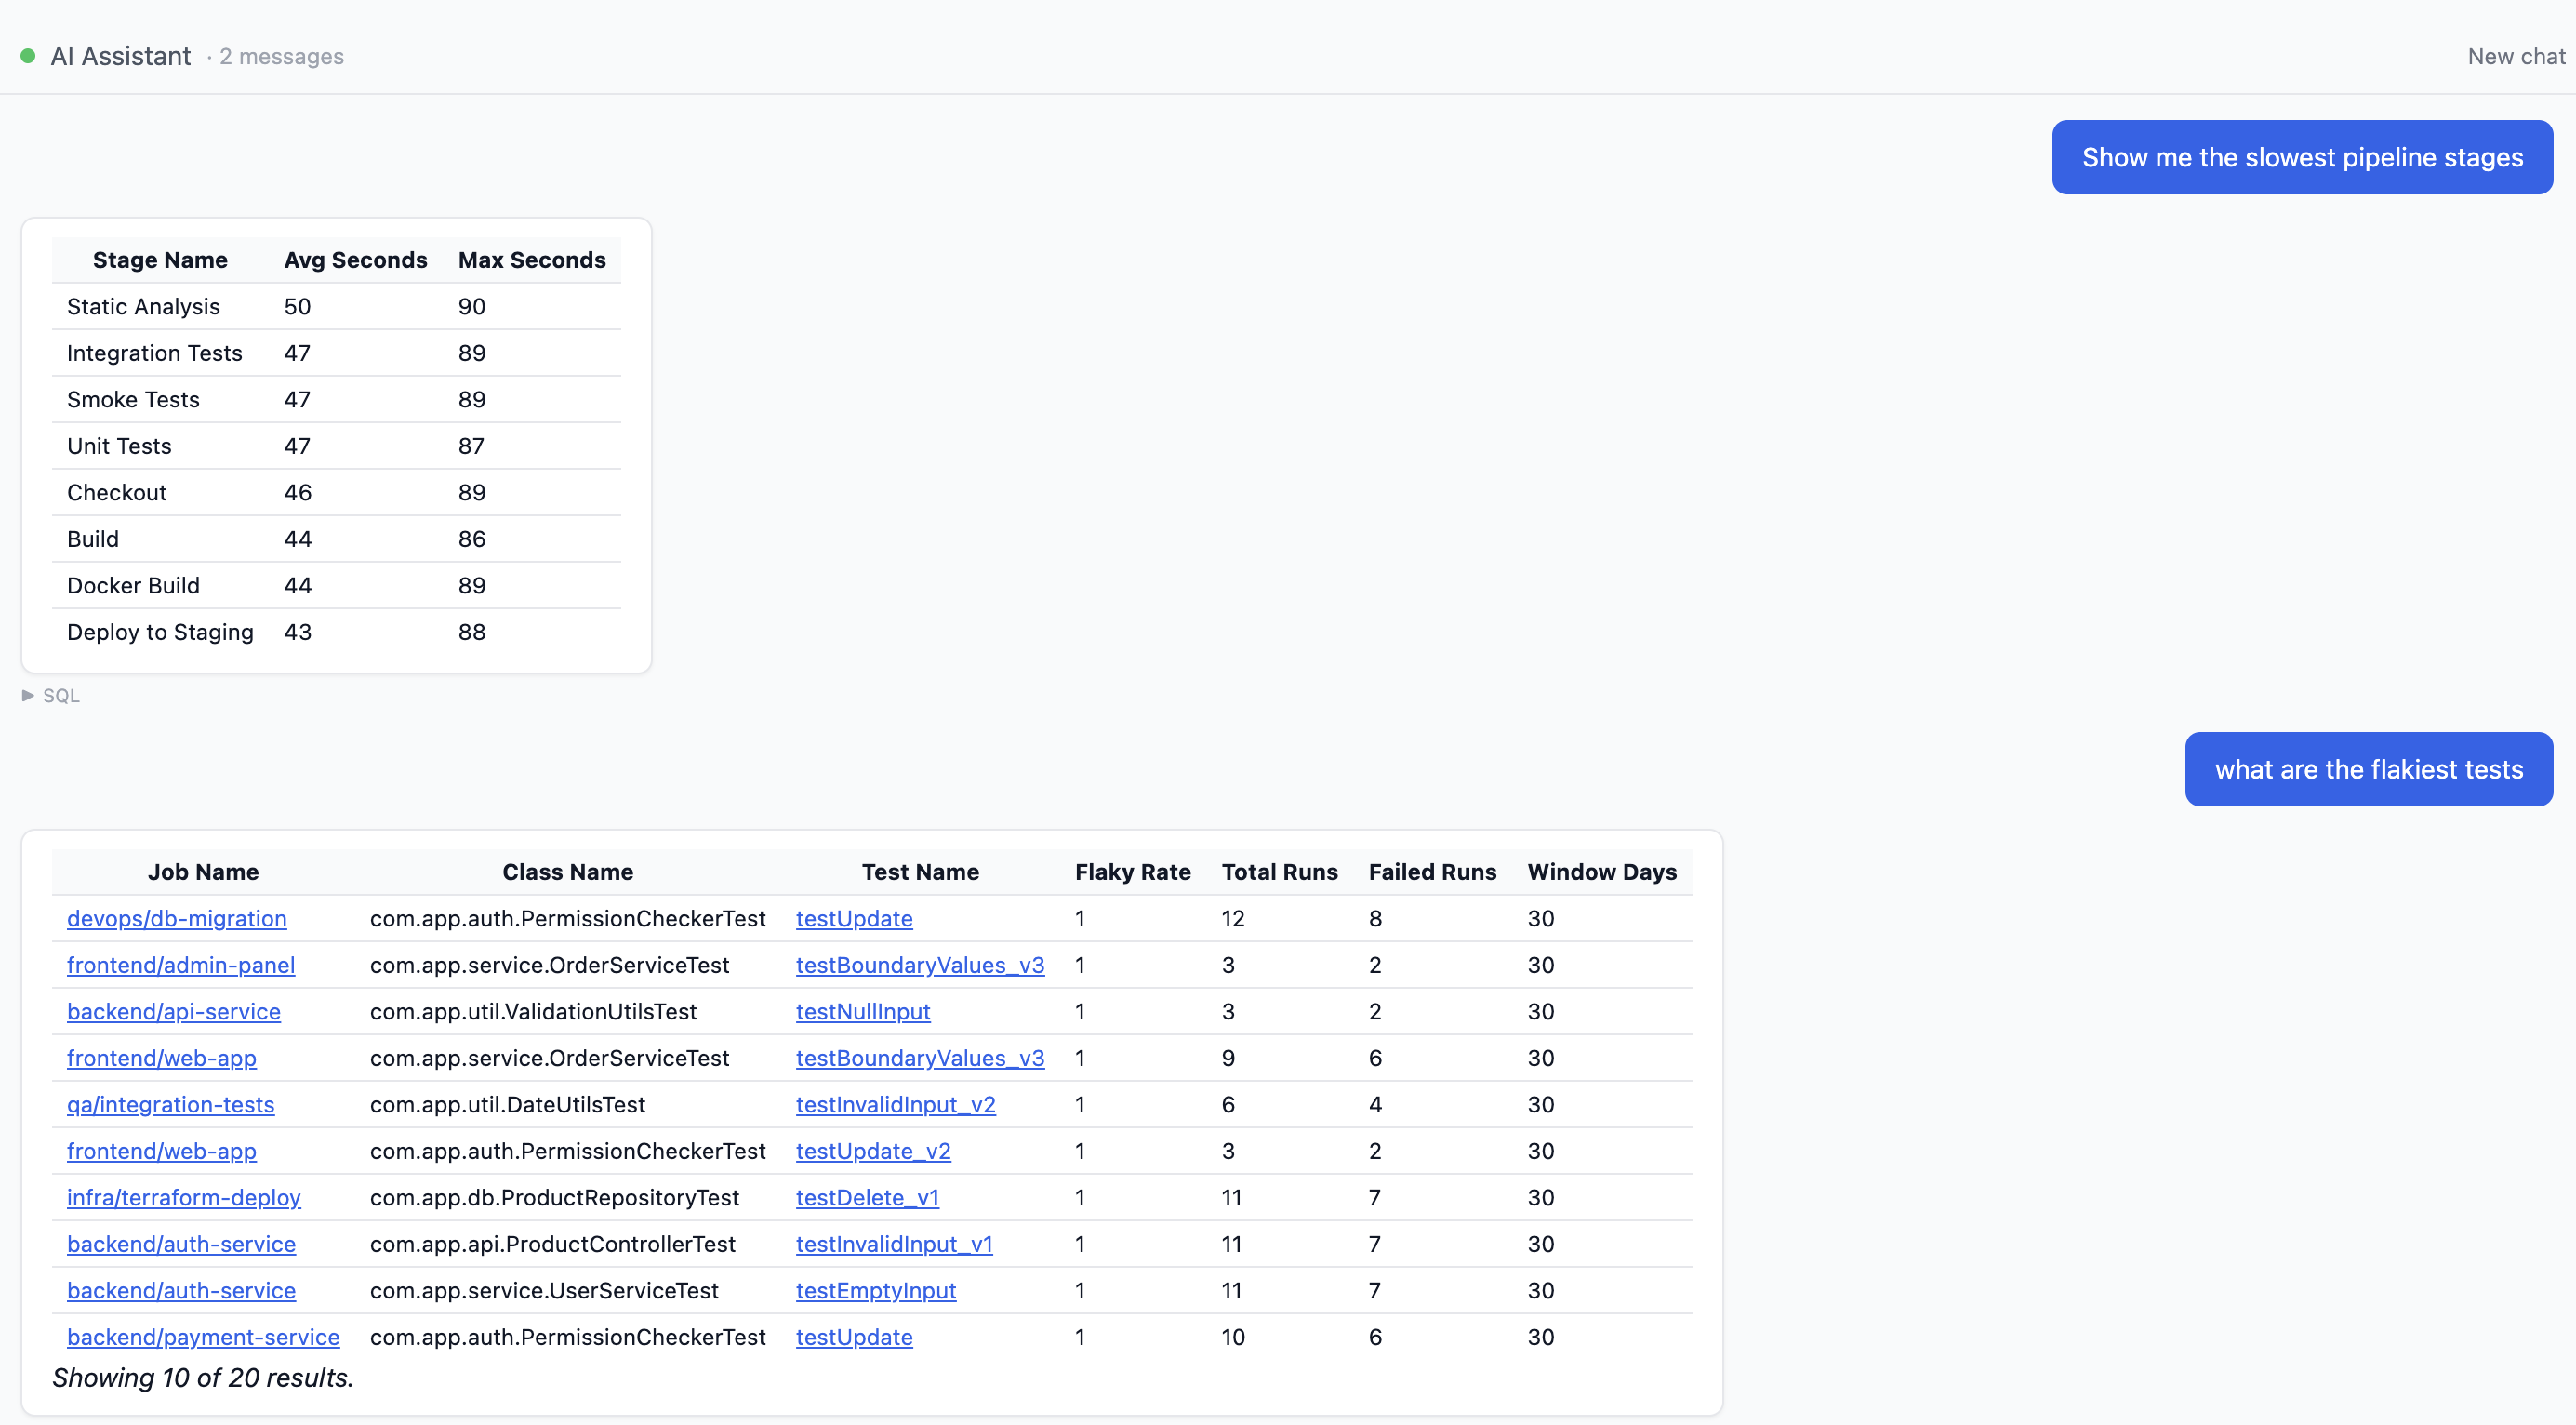
Flaky Test Detection
Track every test execution over time. Flag tests that flip between pass and fail. Customize detection thresholds and view flaky history.
Ask AI
Natural language queries about your build data. Ask "why did the deploy fail?" and get instant answers.
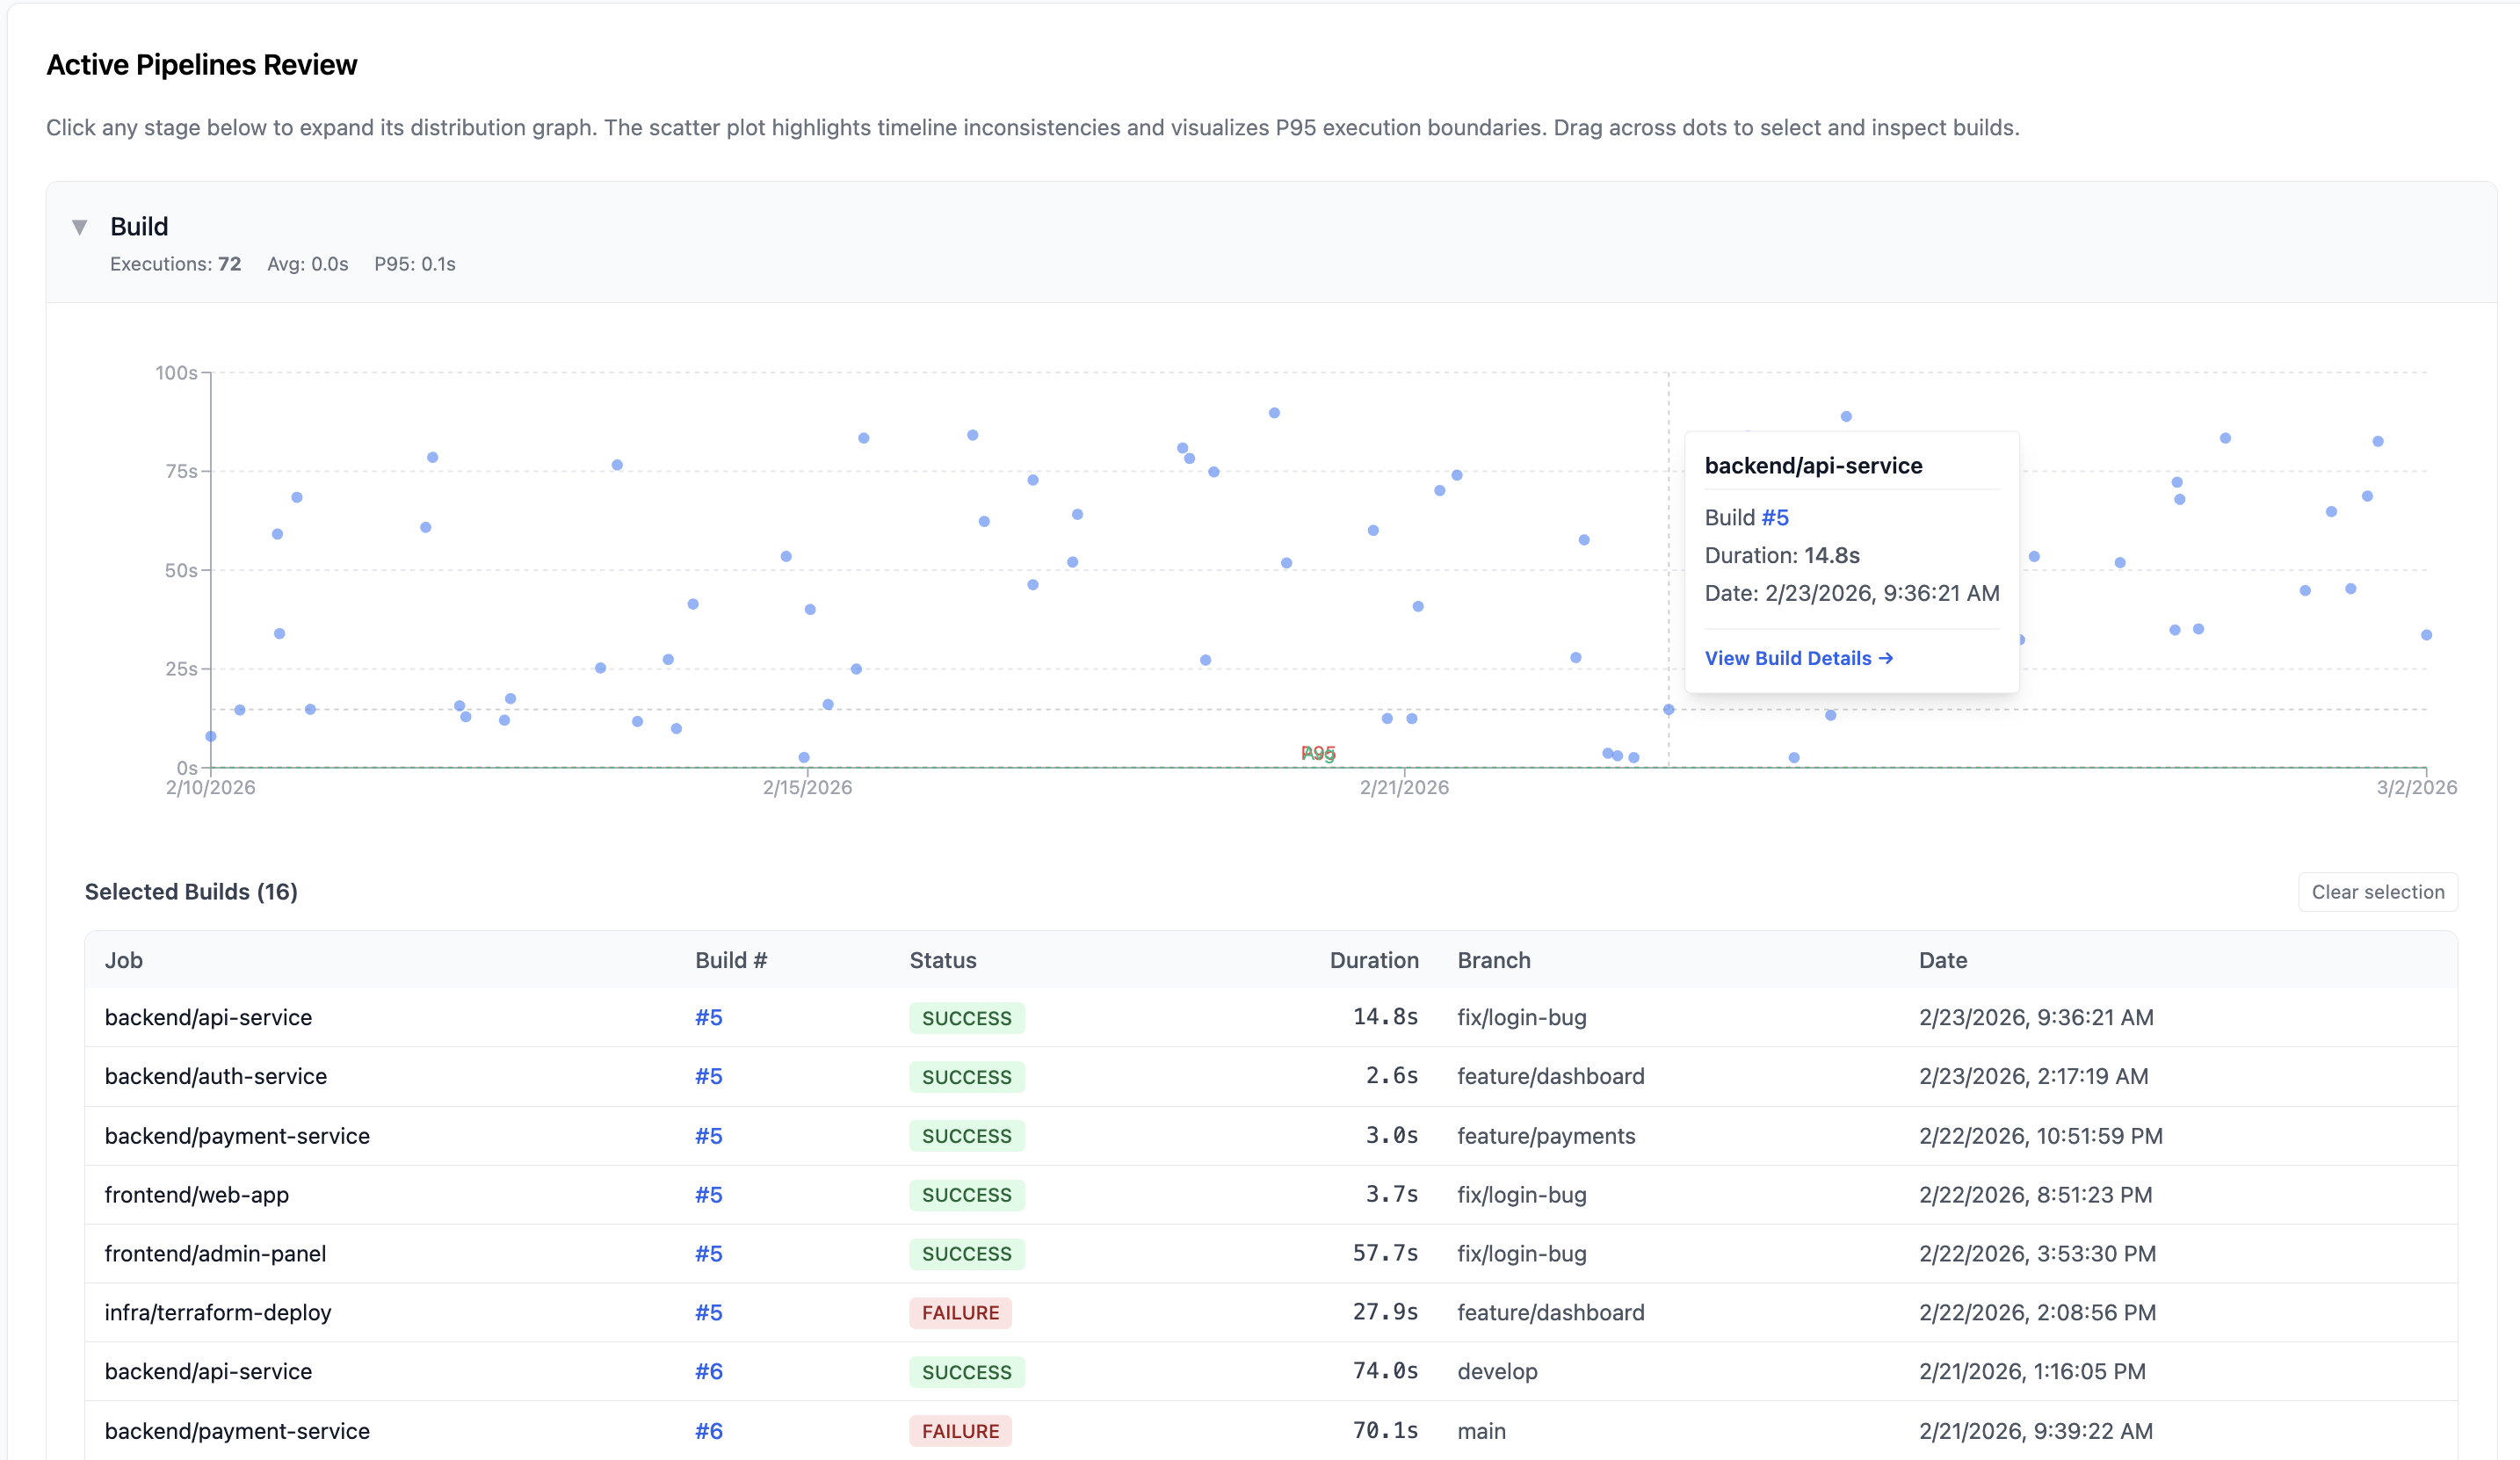
Pipeline Visibility
Visualize pipeline stage execution, identify bottlenecks, and track stage-level duration trends.
Notifications & Alerts
Slack webhooks and email rules with pattern matching. Get alerted on build failures, unstable runs, agent offline events, and queue spikes.
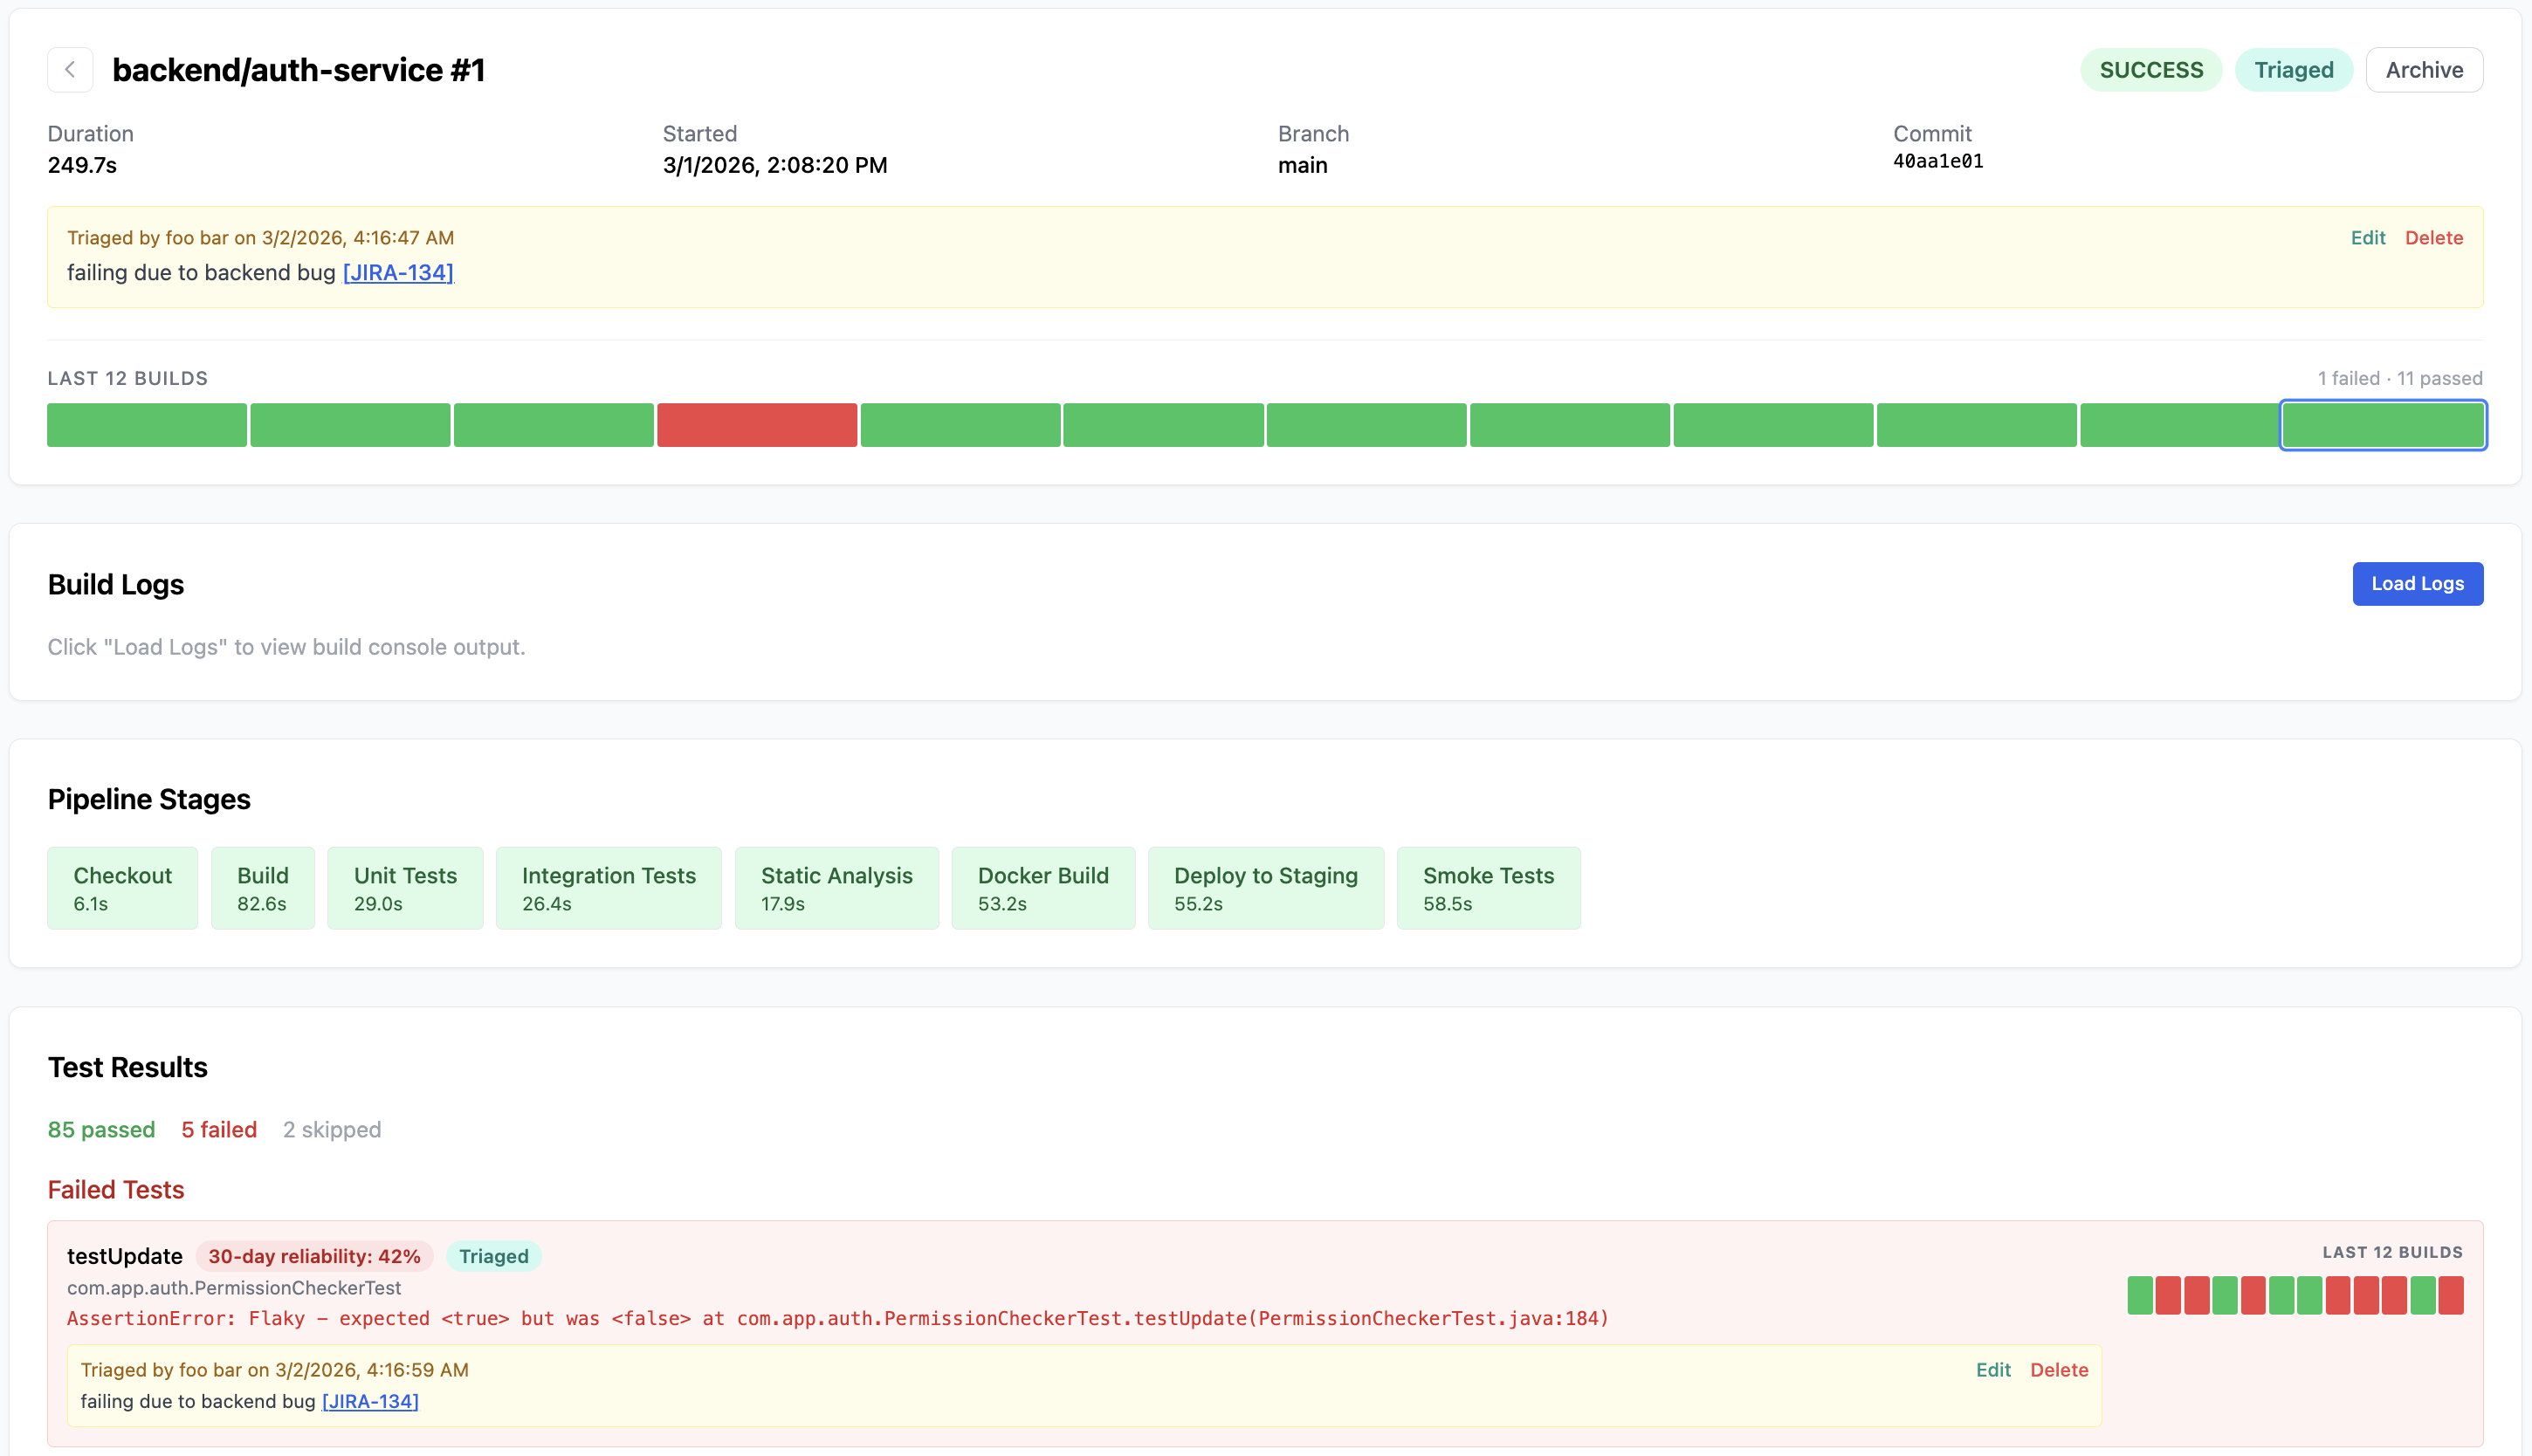
JIRA Integration & Triage
Automatically create and sync JIRA tickets from failing builds and tests. Triage failures directly in BuildButler and push updates back to JIRA.
Up and running in three steps
Connect your CI, configure your TCM rules, and test results sync on every build.
Install the BuildButler Plugin
Add the Jenkins plugin or connect via GitLab/GitHub. BuildButler starts collecting build and test data from your CI pipelines automatically.
Configure TCM Export Rules
Define JSON rules to pattern-match CI jobs and map test results to TestRail projects, ALM test plans, Xray test executions, or Zephyr Scale cycles. Use template variables for dynamic naming.
Results Sync Automatically
Every build triggers an automatic export. Test cases are created or updated in your TCM tool. ALM defects are managed automatically. Plus CI analytics, flaky test detection, and AI insights.
Simple, transparent pricing
Start with 20 builds/day for free. Scale as your team grows.
Starter
For individuals and small teams getting started
- 20 builds per day
- Unlimited CI Servers
- Build results & trends
- Test Case Management
- Flaky Test Management
- JIRA Integration
- Ask AI
- Slack and Email Alerts
- Email Support
Professional
For growing teams that need deeper insights
- Unlimited builds
- Unlimited CI Servers
- Build results & trends
- Test Case Management
- Flaky Test Management
- JIRA Integration
- Ask AI
- Slack and Email Alerts
- Email Support
Enterprise
For organizations that need full control and scale
- Everything in Pro
- Enterprise Support
- Email/Zoom Support
- 48 Hour SLA
- Dedicated Database
- On-premise installation
Frequently asked questions
Ready to automate your test result management?
Start with 20 builds/day for free. TCM integration included on all plans.